
Jaspersoft Business Intelligence reporting software takes information from one or more data sources and presents it in an easy-to-read, highly interactive format for business users.
Design interactive pixel perfect and/or ad hoc based reports for the web, the printer or mobile device.

Jaspersoft data analysis software is used to model, manipulate and visualize any flavor of data using OLAP or in-memory analysis in order to make better decisions quickly.
Explore data with powerful relational OLAP or in-memory analysis against any data source.
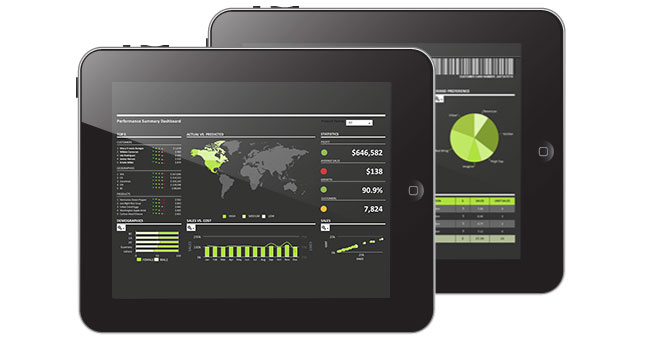
Jaspersoft dashboard software combines data and graphical indicators to deliver at-a-glance summaries of information for users to act on quickly.
Build multi-report dashboards with internal or external data for executives and knowledge workers.

Jaspersoft data integration software extracts, transforms, and loads (ETL) data from different sources into a data warehouse or data mart for reporting and analysis purposes.
You can leverage and combine several disparate relational or non-relational data sources.
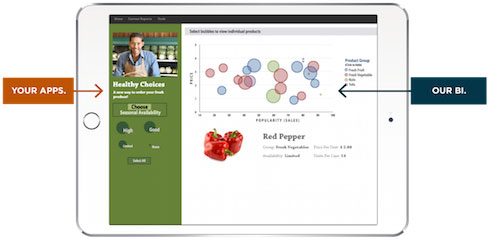
Visualize.js adds value to your apps by making embedding reports & visualizations easy to control, scale, and a joy to use. The only embedded BI tool that works the way developers think.
 Central repository secures reports, dashboards, and analysis views Secure access to reports and analytics down to the row and cell level Audit and monitoring services provide diagnostics, compliance and performance metrics Single Sign-on (SSO) support with a customizable API to simplify the integration and configuration with 3rd party identity management solutions
Business-friendly fields representing relational or non-relational data Filters and security rules at the metadata layer Wizard-driven data virtualization tool combines multiple data sources in a single metadata view without ETL or data warehouse tools
Webservice based platform accessible using Java, XML, HTTP protocols CSS based user interface for customizations, device & “tenant” specific UIs, and corporate re-branding requirements Data source extensibility for integrating with relational, OLAP and Big Data sources